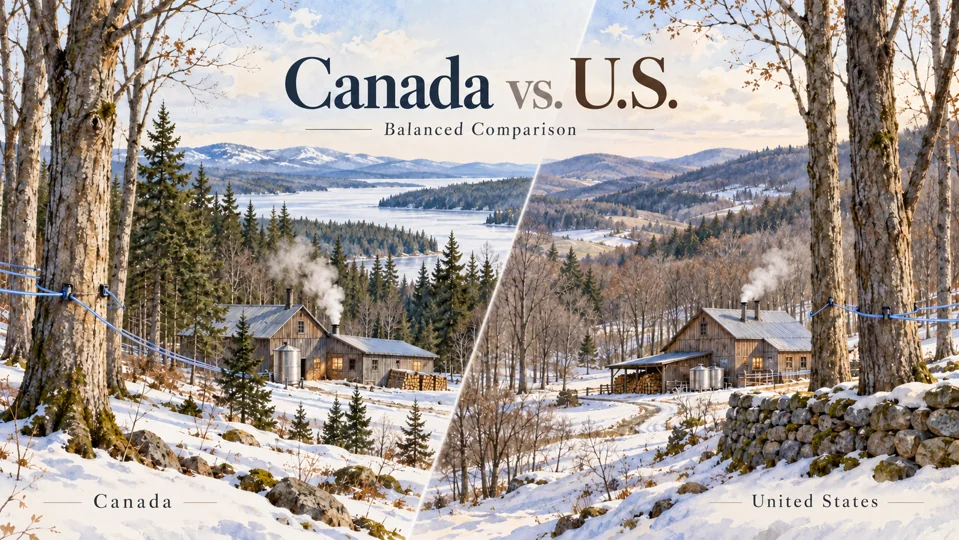
Canada is the larger maple-producing country, but the United States has a substantial maple industry of its own. In 2026, U.S. producers made 5.877 million gallons of maple syrup from 16.47 million taps, according to the U.S. Department of Agriculture. Vermont was by far the largest producing state, but it was not the whole U.S. story. [1]
For European consumers, that distinction matters. "Vermont maple syrup" is a meaningful regional origin, while "U.S. maple syrup" covers production across a much wider group of northern states. The most useful comparison is therefore not Canada versus one small American niche. It is a comparison between two established maple industries with very different scale and internal geography.
U.S. maple syrup at a glance
USDA's June 2026 production report gives a clear national picture. U.S. maple syrup production reached 5.877 million gallons, up from 5.701 million gallons in 2025. The 2026 crop came from 16.470 million taps, with a national average yield of 0.357 gallon per tap. [1]
The 2026 total was about 3.1% higher than the previous season. That annual movement is worth noting because maple production can change from year to year; a single season should not be treated as a timeless measure of the industry's size.
USDA reported maple syrup production in 13 states in 2026. Vermont alone produced more than half of the national total, but New York, Maine and Wisconsin were also major contributors. [1]
U.S. production by reporting state · 2026
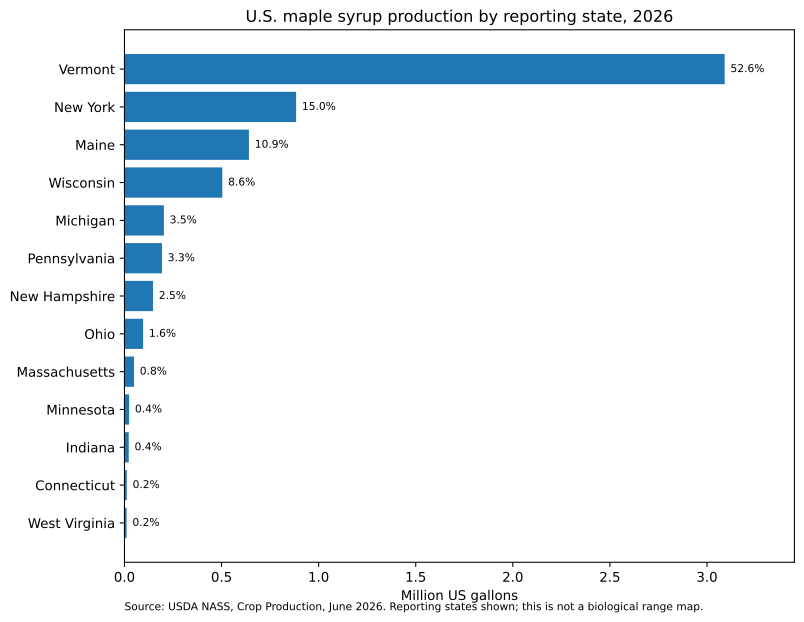
Vermont leads the United States
Vermont produced 3.091 million gallons of maple syrup in 2026. Dividing that figure by the U.S. total of 5.877 million gallons gives a national share of 52.6%. [1][4]
That makes Vermont the undisputed centre of current U.S. maple production. It also explains why Vermont has such a strong maple identity and why European discussions of American maple syrup often focus on the state.
But Vermont should not be turned into a stereotype. Its leading position does not mean all Vermont producers operate on one scale or use one production model. Nor does it justify an easy contrast in which Vermont is described as "artisan" and Canada as "industrial". The MapleSyrup.eu research did not locate a representative Canada-versus-Vermont business-structure comparison that would support that generalisation.
For V1, Vermont should therefore be treated as what the data clearly establish: the leading U.S. producing state and an important regional maple origin. A later dedicated Vermont page can explore state culture, producer structure and tourism in greater depth.
U.S. maple production extends well beyond Vermont
The 2026 USDA figures show a broader production geography than a Vermont-only view suggests. [1]
| State | 2026 production | Share of U.S. total |
|---|---|---|
| Vermont | 3.091m gal | 52.6% |
| New York | 884k gal | 15.0% |
| Maine | 641k gal | 10.9% |
| Wisconsin | 504k gal | 8.6% |
| Michigan | 203k gal | 3.5% |
| Pennsylvania | 193k gal | 3.3% |
| New Hampshire | 147k gal | 2.5% |
| Ohio | 96k gal | 1.6% |
| Massachusetts | 49k gal | 0.8% |
| Minnesota | 24k gal | 0.4% |
| Indiana | 22k gal | 0.4% |
| Connecticut | 12k gal | 0.2% |
| West Virginia | 11k gal | 0.2% |
Vermont, New York, Maine and Wisconsin together accounted for about 87.1% of the U.S. total in 2026. That concentration is substantial, but it is still less extreme than Canada's concentration in Québec, which accounted for 90.0% of Canadian production in 2025. [1][8]
This is one of the most useful structural differences between the two countries: the United States has one dominant state, but a larger secondary tier of producing states remains visible in national output.
New York, Maine and Wisconsin are major maple states too
New York was the second-largest U.S. producer in 2026 at 884,000 gallons, followed by Maine at 641,000 gallons and Wisconsin at 504,000 gallons. [1]
For a European consumer guide, these figures are more useful than trying to create a cultural profile for every state at launch. They establish that American maple syrup can legitimately carry origins other than Vermont, including several regions with substantial commercial production.
Michigan and Pennsylvania each produced around 200,000 gallons in 2026, while New Hampshire, Ohio and a group of smaller reporting states contributed the rest. [1]
The V1 editorial approach should therefore recognise Vermont's leadership without making "American maple syrup" and "Vermont maple syrup" interchangeable terms.
How does U.S. production compare with Canada?
For a direct national comparison, the data years must match. In 2025, USDA recorded 5.701 million gallons of U.S. production, while Statistics Canada reported 18.9 million gallons for Canada. [1][8]
Canada therefore produced a little more than three times the U.S. volume in that same-year comparison. That is a major difference in scale, but it is not a quality ranking.
The regional structures also differ. Canada is exceptionally concentrated in Québec, whereas U.S. production is led by Vermont but distributed more substantially across New York, Maine, Wisconsin and other states.
For the full comparison, see Canada vs U.S. Maple Syrup.
How U.S. maple syrup is graded
The U.S. Department of Agriculture publishes federal grade standards for maple syrup. Under the current standard, U.S. Grade A is divided into four colour and flavour classes: [2][3]
- Golden, Delicate Taste
- Amber, Rich Taste
- Dark, Robust Taste
- Very Dark, Strong Taste
The official light-transmission thresholds are closely aligned with Canada's current Grade A colour classes. That similarity is important because it prevents a misleading national hierarchy: a darker U.S. syrup is not automatically lower quality, and a Canadian origin label is not itself a higher grade. [2][3]
USDA's standard also describes Processing Grade separately from Grade A. For consumers, however, the most useful V1 message is simpler: look at the actual grade and colour/flavour class rather than assuming country of origin tells you how the syrup should taste.
The dedicated Maple Syrup Grades, Colour & Taste page will provide the full side-by-side explanation.
Does Vermont origin matter to consumers?
There is evidence that regional origin matters to some consumers in the U.S. maple market, particularly close to maple-producing regions. A 2021 market study prepared for the Vermont Agency of Agriculture surveyed 1,802 people across nine Northeastern U.S. states. It found that geographic origin was meaningful to many respondents and that Vermont maple received favourable evaluations in that regional market. [5]
That study is useful, but it has important limits. It was commissioned for market development, it focused on the Northeastern United States, and much of the evidence concerns stated preferences rather than observed European purchasing behaviour.
The responsible conclusion is therefore narrow: Vermont origin can carry value for consumers in its North American regional context. The study does not tell us how well European shoppers recognise Vermont, whether they would pay more for it, or whether they prefer it to Canadian origin.
Why is U.S. maple less prominent in European trade data?
The European trade evidence shows a very large supply imbalance between Canada and the United States. In 2024, recorded EU extra-EU imports under HS 170220 - the customs category covering maple sugar and maple syrup together - included about 184,000 kg from the United States, compared with about 12.47 million kg from Canada. The U.S. share was about 1.4% of the recorded EU import volume in that category. [6]
That is strong evidence that direct U.S.-origin supply is much smaller in the recorded European customs data. It is not evidence that Europeans dislike U.S. maple syrup or actively reject Vermont products.
The difference can reflect production scale, export orientation, established distribution networks, importer sourcing, wholesale economics and other supply-chain factors. The trade data do not tell us how an individual shopper would choose if a comparable Canadian and Vermont bottle were placed side by side.
For that reason, MapleSyrup.eu treats supply presence and consumer preference as separate questions.
Do Europeans prefer Canadian syrup to U.S. or Vermont syrup?
The targeted MapleSyrup.eu consumer review found no sufficiently robust direct evidence that European consumers prefer Canadian maple syrup over Vermont or other U.S. maple syrup. [7]
General European food research shows that country of origin can influence evaluation and choice. North American maple research shows that regional origin can matter within maple-producing markets. Neither finding proves a specifically European preference for Canada over Vermont.
This evidence gap is particularly important on a U.S. page. A small U.S. share of European customs flows must not be rewritten as a negative consumer judgement about American maple syrup.
What does "U.S. maple syrup" tell a buyer?
A U.S. origin statement tells you provenance at the national level. It does not tell you that the syrup comes from Vermont, nor does it automatically reveal a flavour profile, production scale or quality ranking.
For a more useful purchasing decision, look for:
- the declared state or region where available;
- the Grade A colour/flavour class;
- whether the product is genuine maple syrup rather than a maple-flavoured table syrup;
- ingredient and label information;
- certification claims where relevant;
- price and intended use.
A Vermont origin can be interesting because Vermont is the leading U.S. producing state. A New York, Maine or Wisconsin origin is equally legitimate as a geographic description of U.S. maple production. The product should be judged on what it actually is, not on a national or regional stereotype.
The evidence-based takeaway
The United States is a substantial maple-producing country. USDA recorded 5.877 million gallons in 2026, and Vermont accounted for 52.6% of that total. New York, Maine and Wisconsin were also major producers, and production was reported across 13 states. [1]
Compared with Canada, the U.S. industry is smaller and somewhat less geographically concentrated in its leading region. The two countries' modern Grade A colour/flavour systems are closely aligned, and the available research does not support an automatic quality ranking based on nationality. [2][3]
For European consumers, U.S. maple syrup is much less prominent in recorded import supply than Canadian maple. What current evidence does not show is that Europeans have made a collective quality judgement against U.S. or Vermont syrup. [6][7]
That distinction is central to MapleSyrup.eu: Vermont matters, the wider U.S. maple industry matters, and origin should be described accurately without turning geography into a quality verdict.
Sources & reading notes
Numbered references belong to this article. Dates, definitions and limitations matter.
- USDA National Agricultural Statistics Service
Crop Production, June 2026 ↗2025 national / 2026 state data used · US production; Vermont 2026 production.
- USDA Agricultural Marketing Service
Maple Syrup Grades & Standards ↗Current page checked 10 Sep 2026 · Federal Grade A framework and Processing Grade overview.
- USDA Agricultural Marketing Service
United States Standards for Grades of Maple Syrup ↗Current standard used in dossier · US Grade A colour and flavour classes.
- Vermont Agency of Agriculture, Food and Markets
2026 Vermont Maple Season Production Once Again Leads the Nation ↗2026 crop; 11 Jun 2026 · Vermont production and tap-count cross-check.
- Atlantic Corporation / Vermont Agency of Agriculture, Food and Markets
Identifying Market Opportunities for Vermont Maple Syrup Producers ↗Survey 2020-21 · Vermont origin preferences; contextual only.
- UN Comtrade via World Bank WITS
HS 170220 trade data ↗2020-2024 series; 2024 used here · EU extra-EU origin shares.
- MapleSyrup.eu Targeted Deep Research 2
Canadian Origin, Vermont and European Consumer AwarenessThrough 10 Sep 2026 · Direct maple preference evidence gap. Internal editorial synthesis; the underlying dossier is not publicly hosted.
- Statistics Canada
The Daily - Maple products, 2025 ↗2025 crop; corrected 16 Dec 2025 · Corrected 2025 production and annual change.
Download the complete source register (CSV) ↓ · Our methodology